06 | The Product tanker market
Analysis Creates Expertise
Supply and demand
Demand for oil tankers is determined by world oil demand and trade, as well as the location and accessibility of oil products supply relative to the principal locations for discharging such cargoes. The metric of tonne-miles is often used as a proxy for oil tanker demand and is a product of (a) the amount of cargo transported in tankers, multiplied by (b) the distance across which cargo is transported. Macroeconomic forces, both globally and regionally, significantly impact world oil products consumption and, consequently, the volume of oil products transported by sea. The average distance of sea transportation of oil products is affected by trading patterns, which are determined by a combination of economic and geographic factors, refinery developments, regional products imbalances, seasonal variations, oil price trends and differentials in oil products prices between regions, environmental influences, exceptional climatic conditions and geopolitical events.
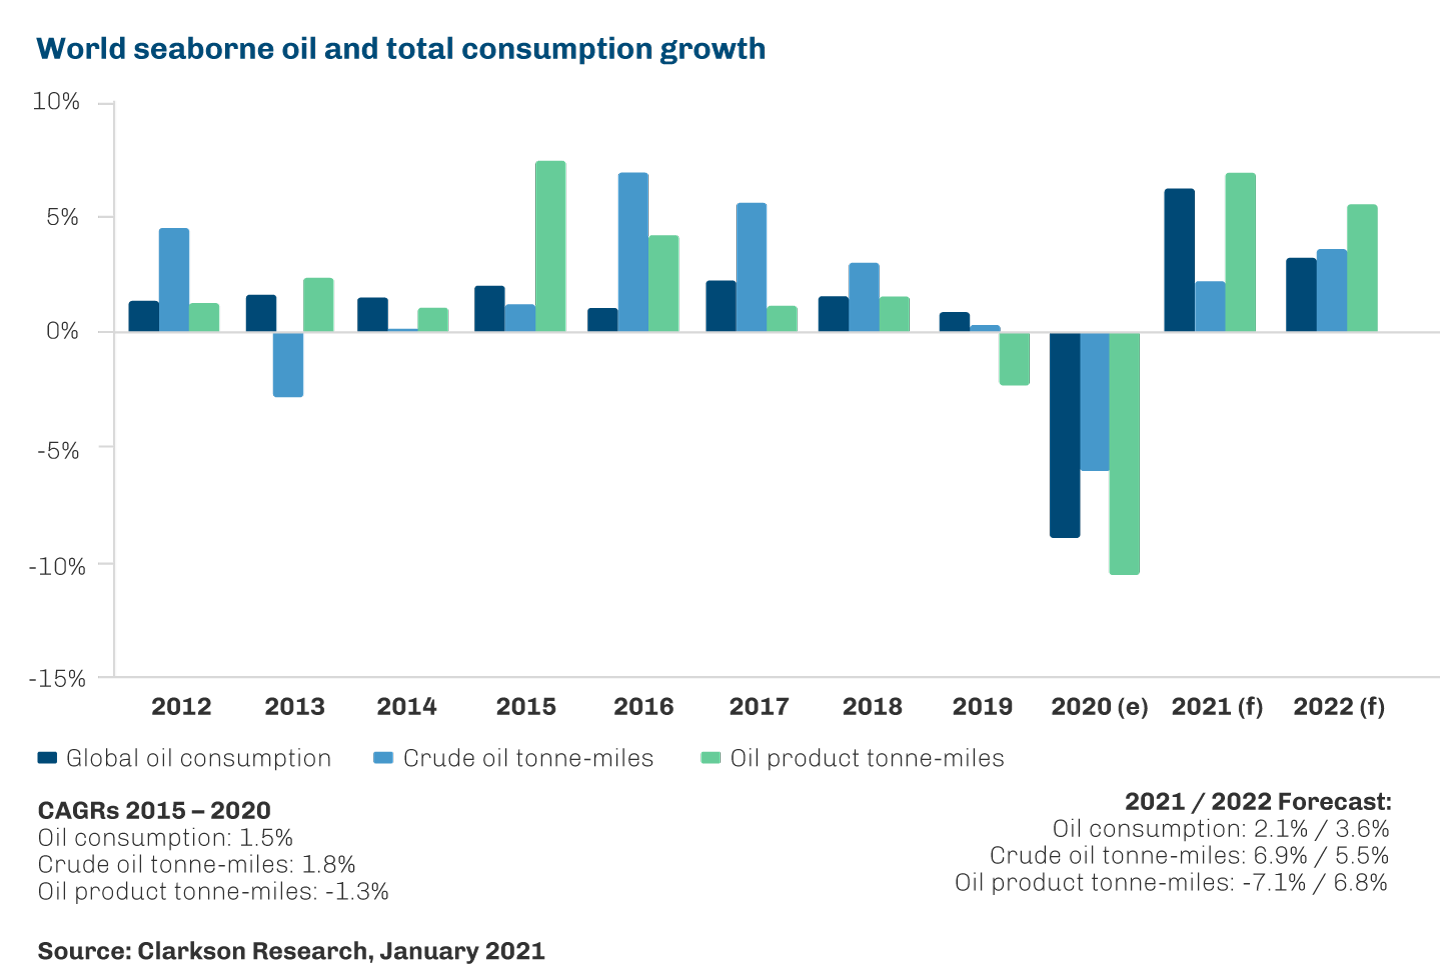
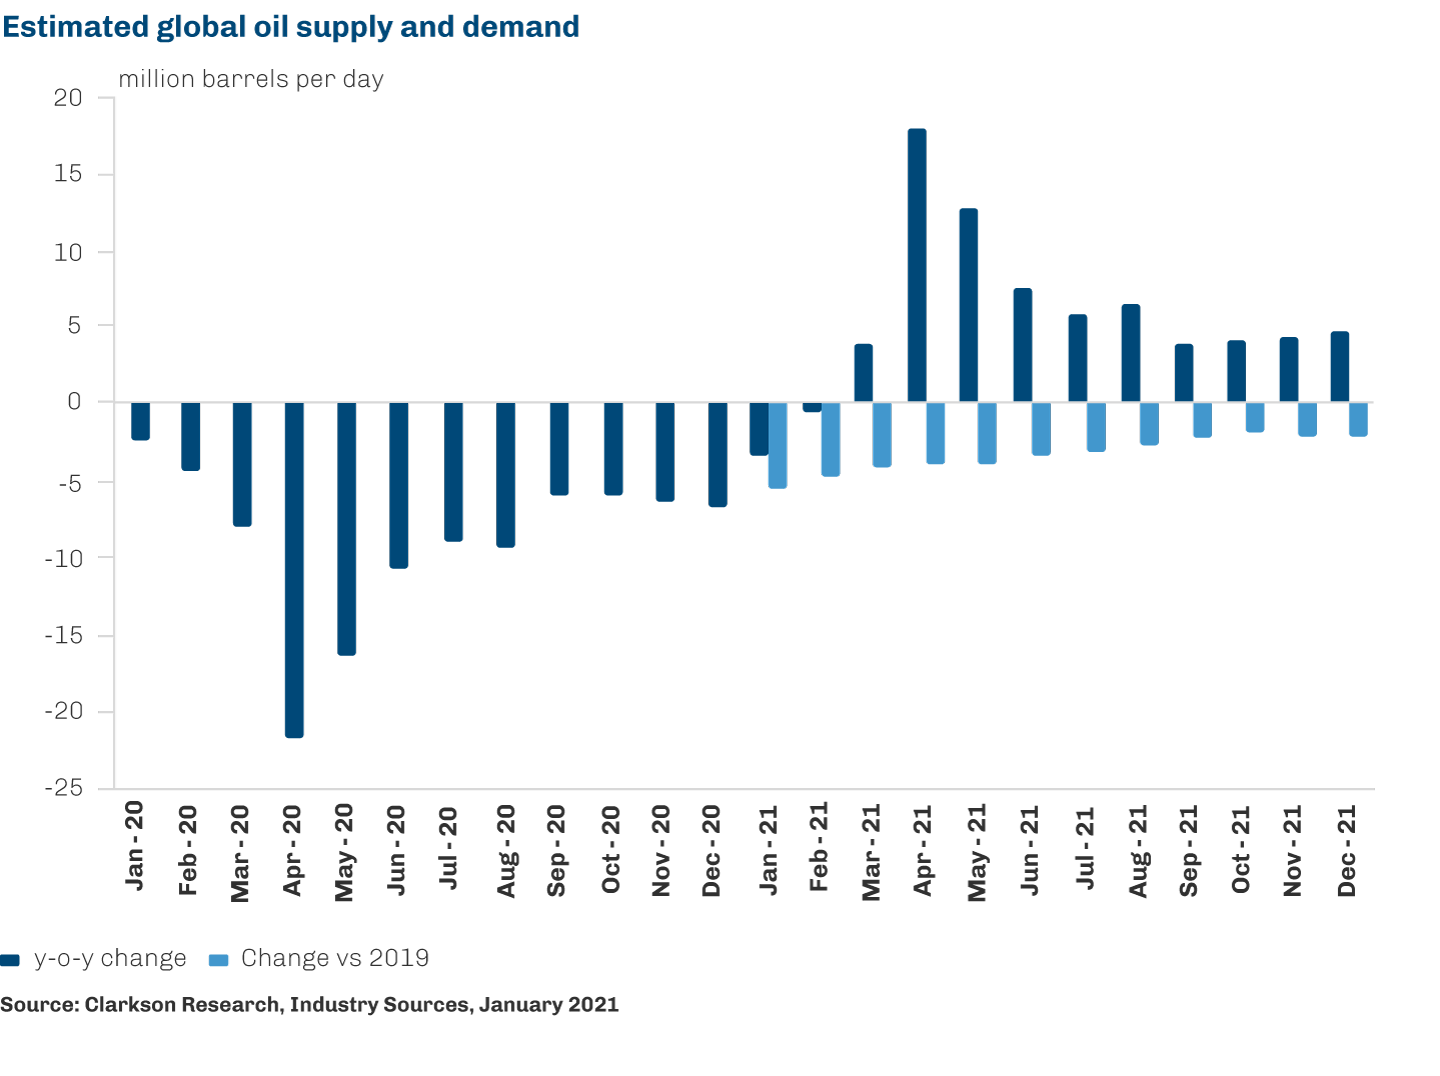
Daily oil demand increased from approximately 88.6 million barrels per day in 2010 to 100.3 million barrels per day in 2019, driven by increasing world population, global economic expansion and rising oil consumption in the transportation industries of developing countries. The developing world has thus been a key driver of continued growth in global oil consumption. That said, Covid-19 has at least temporarily disrupted the continued growth across the last decade, with global oil demand dropping to 91.4 million barrels in 2020. To contextualise the scale of the 2020 drop in oil demand, we can compare the drop against the recorded reduction in oil consumption following the financial crises in 2008-09, which was 1.5 million barrels y-o-y.
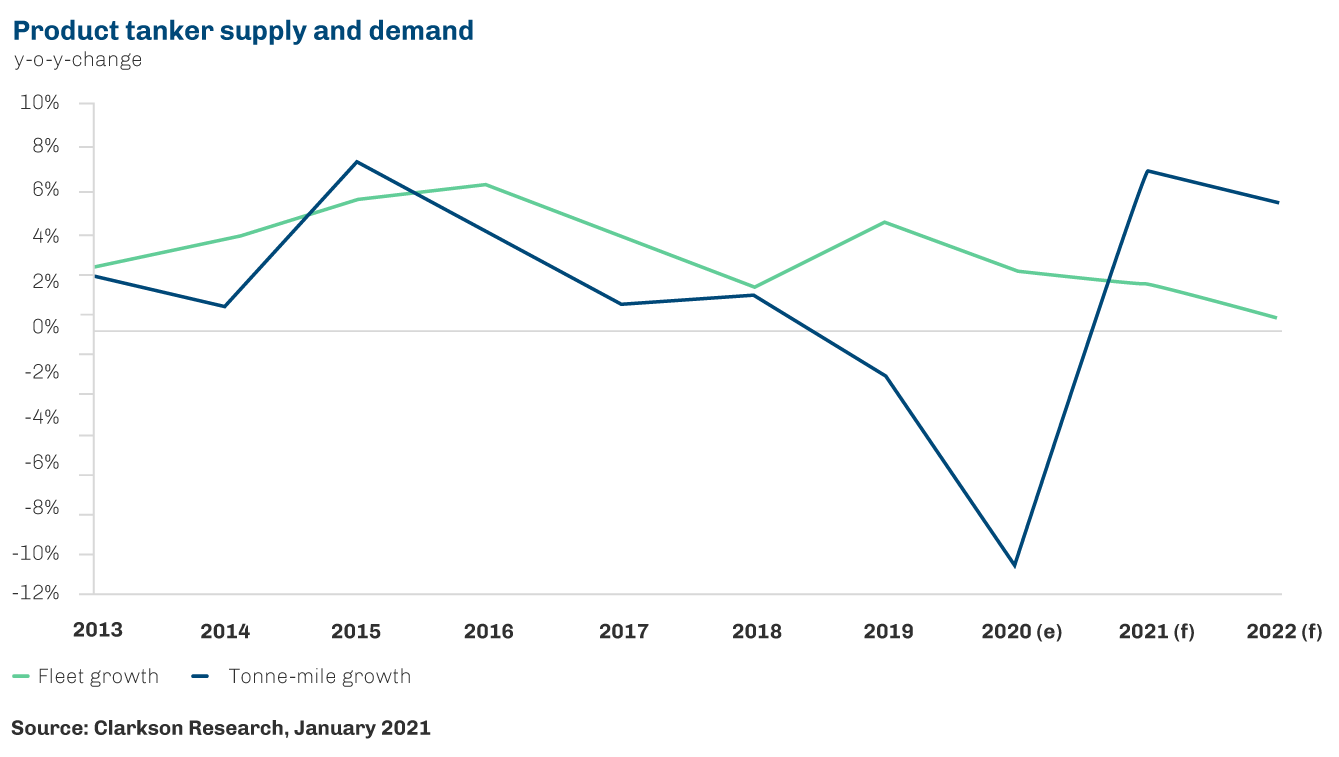
Key statistics comparing supply and demand growth in global oil and in the product tanker industry have been provided in the graphs on this page.
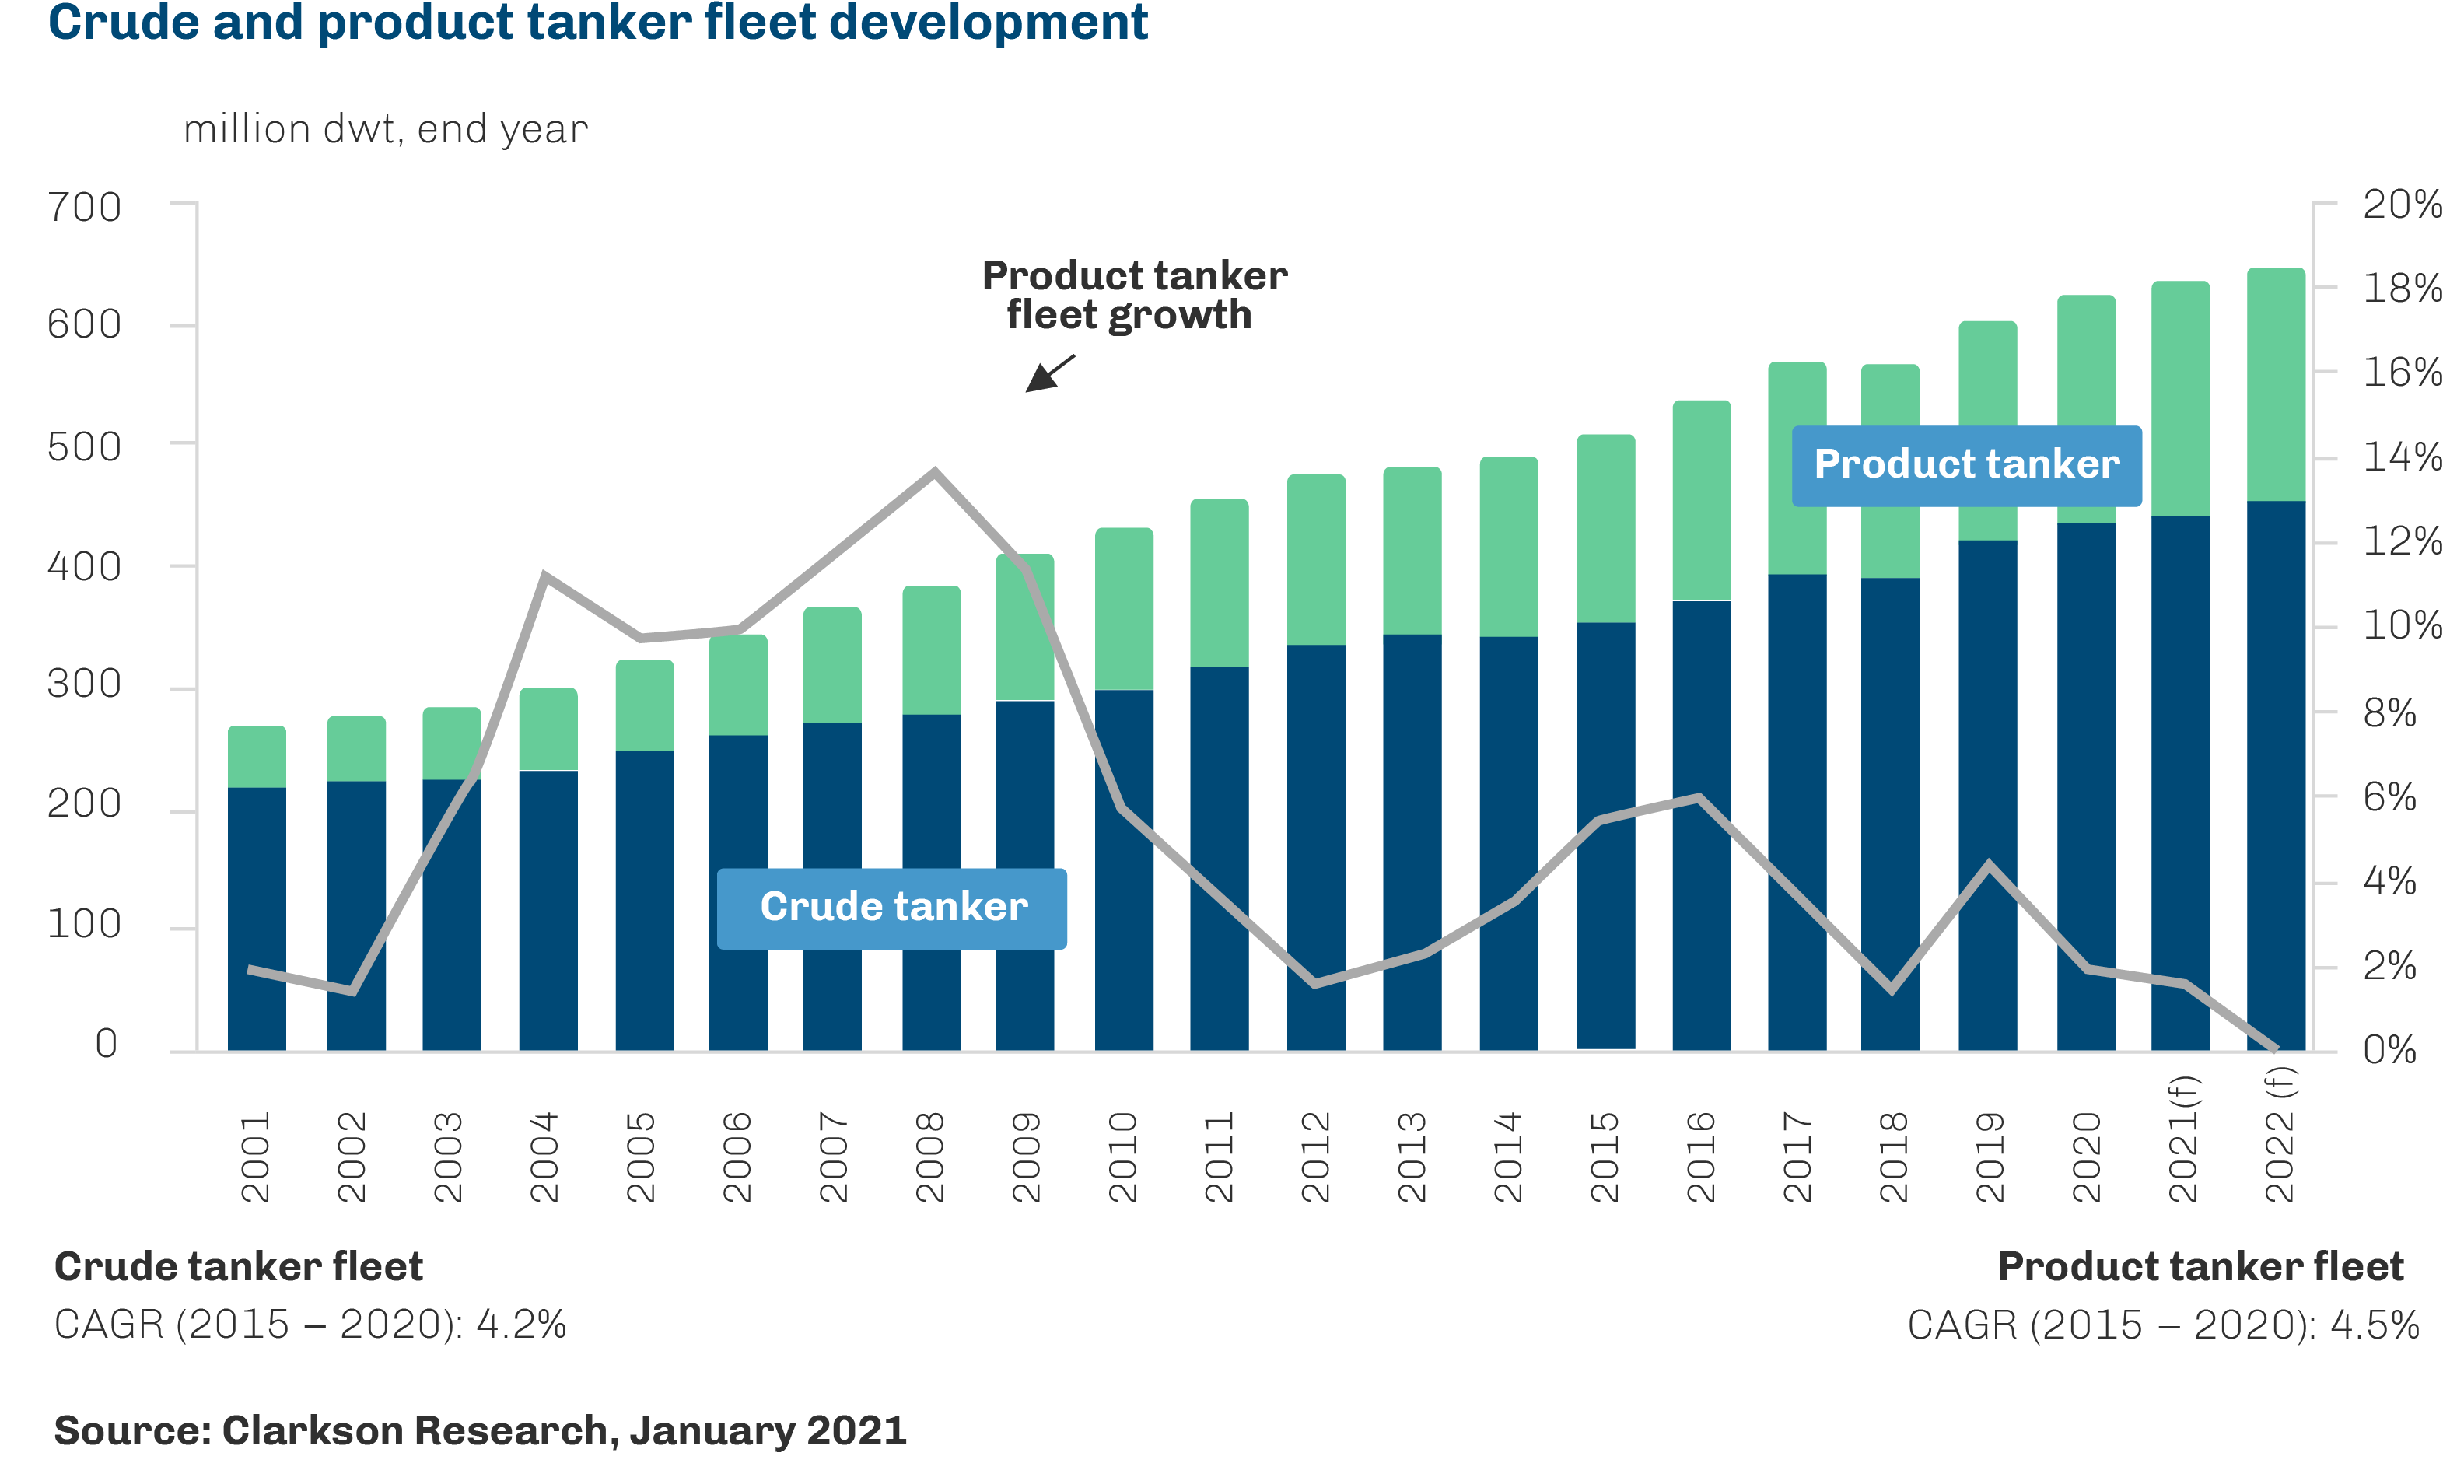
Tanker supply is determined by the size of the existing fleet as measured by cargo carrying capacity. It is influenced by a variety of factors, primarily the size of the existing fleet and ship size, the rate of deliveries of newbuilds, scrapping, and other operating efficiency factors affecting the number of ships available for charter (for example, storage, time in port, and congestion and vessel speed).
The fleet of product tankers increases as a result of the construction and delivery of newbuilds to the fleet and decreases as a result of vessel loss or the removal of older vessels by demolition or other means. Permanent removal of a vessel can occur within a relatively short timeframe, typically within three months. However, the construction of a newbuild products tanker typically requires between 18 months and three years from contract signing to delivery of the vessel by the shipyard, depending on the schedule of the relevant shipyard’s order book. Today’s supply-side dynamics are occurring against a backdrop of more limited global shipbuilding capacity than in the late 2000s, as well as limited availability of ship finance.
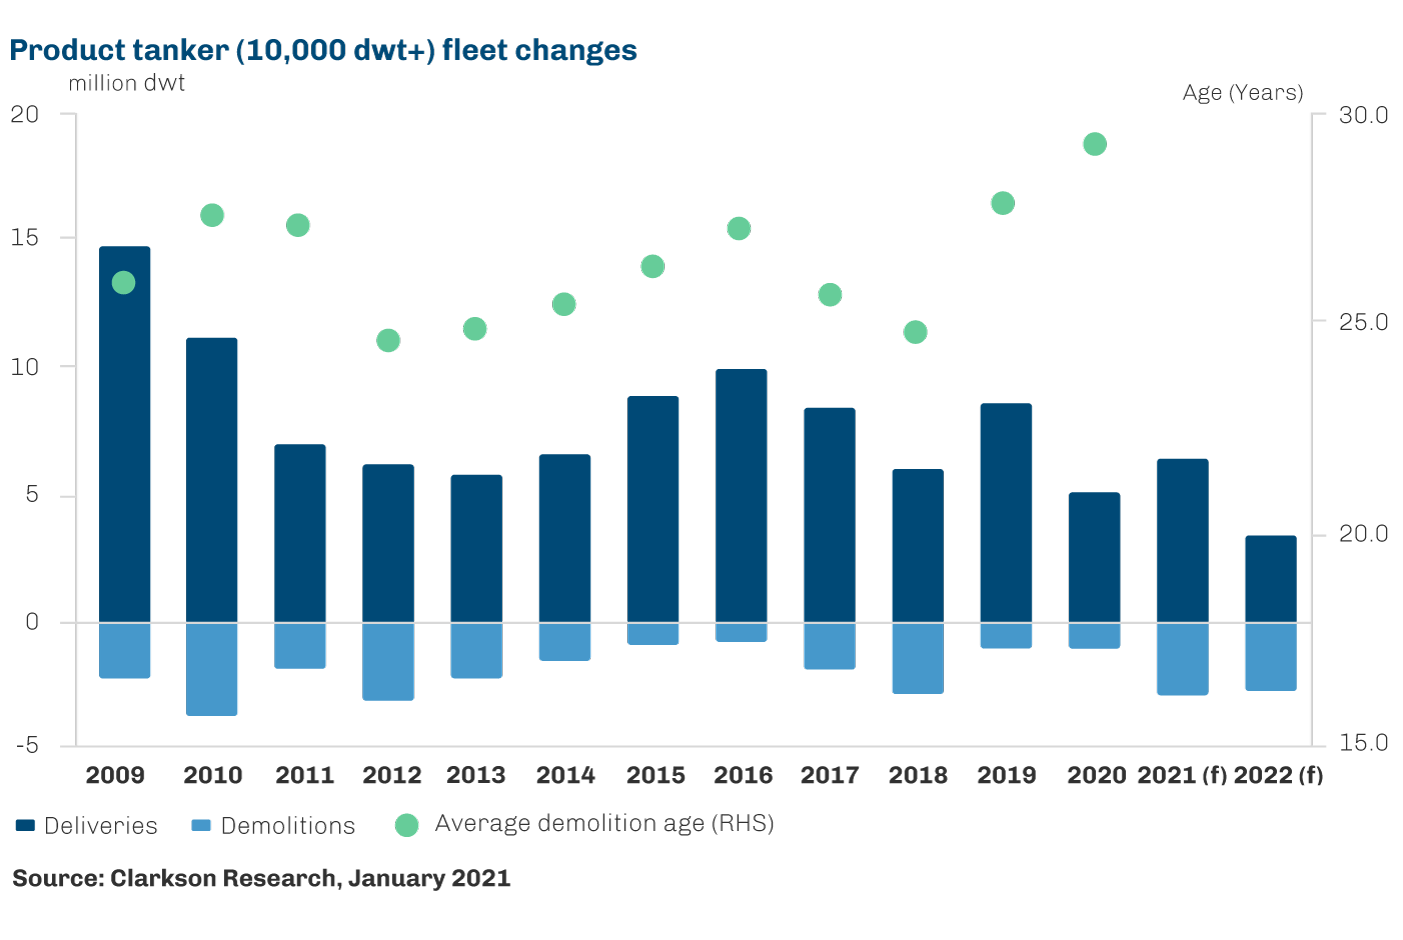
Elsewhere, the product tanker order book reached a historic low of 6.8% of the fleet (in dwt) at the start of 2021, suggesting a corresponding period of lower fleet growth from 2022. Meanwhile, an accelerating green transition and the IMO’s timeline for 20 million DWT regulations related to ship emissions have led to many initiatives such as the Sea Cargo Charter. In addition, the uncertainty surrounding green propulsion technology has also had a limiting factor on newbuilding activity and expected scrapping in 2021 and 2022 should limit the net fleet growth to 2.3%.