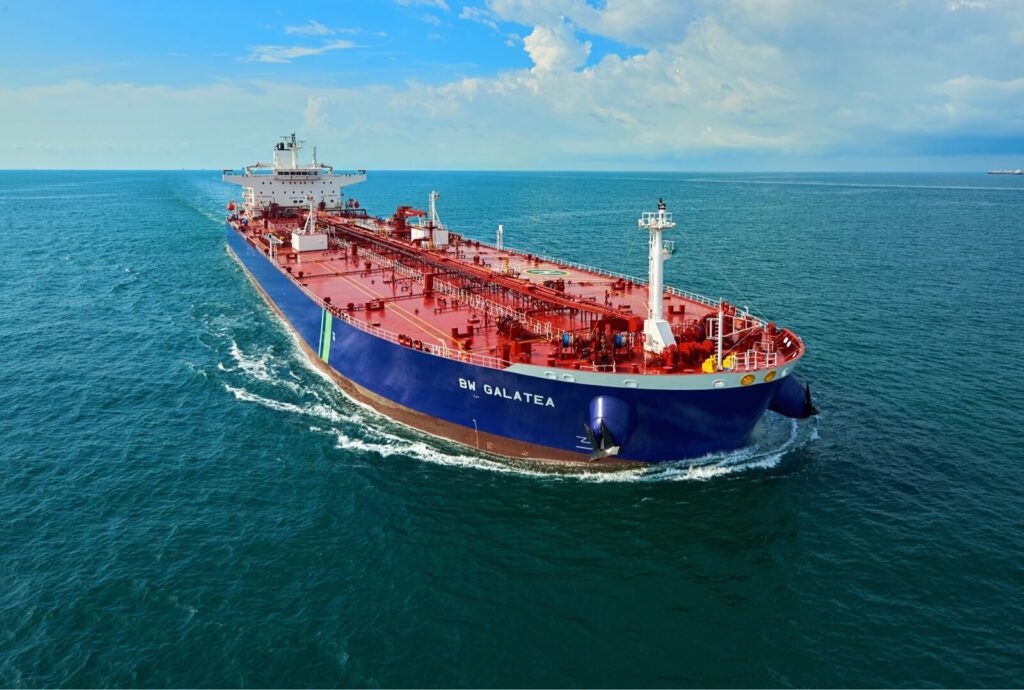
06 | The Product tanker market
Analysis Creates Expertise
2020 Summary
The product tanker market experienced an extraordinary 2020, with record highs and near record lows achieved due to disruptions from the Covid-19 pandemic. In the first half of 2020, disruptions to the oil sector led to unprecedented demand for tanker floating storage, whilst significant discharge delays and logistical issues exacerbated the impact, causing a market “super-spike” in earnings in April.
According to Clarksons Research, average MR earnings peaked at a record USD 74,000 per day in April, whilst LR2 earnings on the benchmark Ras Tanura-Chiba route spiked to USD 168,000 per day. Weighted average earnings across product tanker markets hit a record of over USD 90,000 per day in late April and the first half of 2020 was the best half-year period since 2008. This spike’s key driver was surplus oil supply as global oil demand plummeted amid ‘lockdowns’ worldwide, which in early April affected c.40% of the world’s population to varying degrees and led to a significant global decline in jet fuel, gasoline and diesel demand. A drop of c. 22 million barrels per day in y-o-y oil demand was estimated during “Black April”. Meanwhile, Saudi Arabia and Russia commenced an oil ‘price war’, and the concurrent flood of crude oil into global markets led to a collapse in prices and development of a steep contango in oil futures. Landbased storage filled rapidly and prompted a surge in demand to store oil at sea, significantly tightening fleet supply, with c.10% of the product tanker fleet in dwt terms absorbed at the peak in early May according to Clarksons Research data.
The y-o-y contraction in global oil demand narrowed progressively beyond April, as ‘peak lockdown’ measures were relaxed and summer holiday periods in the Northern Hemisphere supported a rise in transport fuel demand. However, towards the end of Q3, global Covid-19 cases began to rise once more and numerous regions, mainly in the West, suffered from severe second waves in Q4, resulting in renewed “lockdown” measures which impacted the nascent recovery in global mobility and economic growth. The deficit in global oil demand relative to the same period in 2019 is estimated to have widened from c. 6 million barrels per day in September-October to c. 7 million barrels per day in December. Overall, global oil demand is estimated to have contracted by 8.8% y-o-y in 2020 to 91.4 million barrels per day. Nonetheless, China remained one bright spot, with Chinese oil demand registering y-o-y growth in the second half of 2020 and falling by just 0.5% in the full year, compared to estimated falls of c.12% in US and European oil demand.
Alongside the downturn in global oil demand, seaborne oil products trade came under considerable pressure, falling by 18% y-o-y across Q2 2020 (peak impact of -27% y-o-y in May) according to Clarksons Research estimates. Downward pressure stemmed from sharp declines in global refinery runs and high regional inventories owing to the impacts from Covid-19 on oil demand. International Energy Agency (IEA) data suggests that global refinery throughput fell by c.15% y-o-y across Q2 to less than 70 million barrels per day as utilisation rates were cut and capacity was taken offline. Imports of oil products into all regions came under pressure as demand dropped, whilst traditional major products exporters faced headwinds from lower refinery runs and the soft external demand. Overall, global seaborne oil products trade is estimated to have fallen by 11.2% in 2020.
The downturn in oil trade and gradual unwinding of floating storage led to product tanker earnings easing back from April-May’s highs. According to Clarksons Research data, by end 2020, the share of product tanker fleet capacity engaged in floating storage had dropped to c. 3% and earnings in all sectors reached near record lows at points across Q4 2020. In November, clean MR and Handy spot earnings averaged c. USD 5,300 per day and c. USD 1,200 per day respectively, the second-lowest monthly average on record in both sectors. Nonetheless, in the full year 2020, the impact of floating storage is estimated to have limited growth in the trading product tanker fleet to just 0.2%, compared to growth of 2.4% in total capacity (10k+ dwt).
The product tanker market has remained weak into early 2021, as cargo volumes remain low, with refinery throughput estimated to have remained 5-6% lower y-o-y in January and 7% below January 2019 levels. Spot earnings eased back from the moderate improvements that had materialised in December, and in the LR2 market, earnings on the Ras Tanura-Chiba route fell to a four-year low of USD 4,055 per day in late January, having reached almost USD 18,000 per day in mid-December. Meanwhile, clean MR earnings remained relatively steady at weak levels, having varied within a band of USD 4-8,000 per day since early September.