01 | Management review: A new normal
A new normal
The decade started with a pandemic that shook the world, Covid-19. Hafnia played its part to support the world through the crisis by keeping our fleet moving, with credit to our dedicated employees at sea and on shore who delivered transportation and floating storage throughout 2020, safely and responsibly.
Due to restrictions imposed as a result of the world-wide lockdown and the suspension of the majority of international flights, our vessels were unable to conduct normal crew changes for much of the year. The crew onboard our ships, serving on extended contracts, experienced great uncertainty about when they would be able to reunite with family and friends ashore. As a means of overcoming the crew change crisis, Hafnia has signed the Neptune Declaration on Seafarer Wellbeing and Crew Change. This by itself is not enough, which is why it is only one of the many things we’re doing to support our crew during these challenging times. We’ve also introduced higher overtime wages, improved internet access and increased wellness activities.
For our staff on shore, working from home has become the norm. Hafnia did a great job working together while being apart. It is impressive to see how our young but strong culture has survived and adapted to this “new normal”.

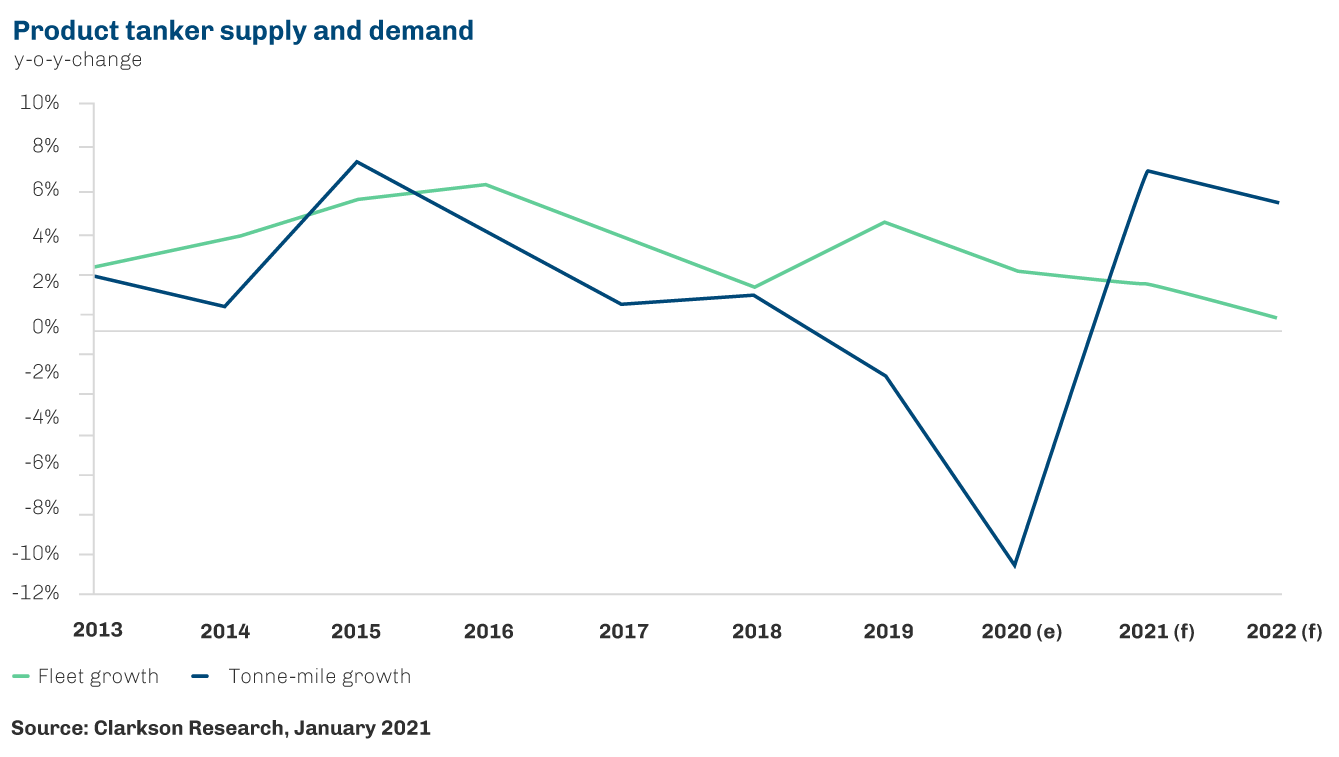
Product tanker market prospects
Going into 2020, prospects for the product tanker market appeared promising, with the new IMO 2020 regulations presenting both opportunities and uncertainties. With the spread of Covid-19 and the subsequent drop in oil consumption by c. 22 million barrels per day y-o-y in April 2020, the world product tanker fleet started acting as floating storage. The Russia–Saudi Arabia oil price war triggered in March 2020 caused oil prices to drop below zero. For a short while, product tanker rates and oil inventories both reached all-time highs. In the second half of 2020, oil prices increased while oil consumption recovered slightly towards pre-pandemic levels.
In the first few months of 2021, the oil inventories continue to rebalance, with much of the world still in lockdown.
The outlook for the product tanker sector in the first half of 2021 appears challenging, with many factors expected to continue to weigh on market conditions. Against a backdrop of ongoing impacts on oil demand from renewed lockdowns in key regions and the resultant pressure on refinery throughput, pressure is further expected from the continued easing in floating storage and the underlying fleet expansion of 2.0% in the product tanker sector.
However, the latest trade projections suggest a bounce-back in seaborne products trade in the second half of 2021 as oil demand recovers and inventories return to normal. Combined with the rebound in demand, seasonal uplift is expected during the second half of the year.
1.2 million barrels per day of global refinery capacity was closed, mothballed, or converted in 2020 (not including capacity temporarily offline due to impacts of Covid-19), with an additional 0.7 million barrels per day announced for 2021. Whilst new ex- port-oriented capacity is slated to start up this year and next, this will likely force inefficient refineries near to consumption areas to close, thereby improving tonne-mile demand.
The total product tanker tonne-mile trade is projected to exceed growth in terms of tonnes, expanding by approximately 7% and 5.5% in 2021 and 2022, respectively.
Expanding Hafnia
Despite the disruption caused by the pandemic, I am happy to report that we have further expanded our business. We have set up a brand new pool called “Hafnia Specialized” for the smaller product tanker segment (tonnage under 20,000 dwt).
New projects with environmental drivers
Hafnia has implemented clear and effective measures to promote decarbonisation. We are firmly committed to providing safe, sustainable and efficient hydrocarbon transportation solutions while participating in global efforts to combat climate change.
In 2020, numerous capital commitments were made towards increasing the sustainability of our business:
- Our investment in Northwest Innovation Works towards developing a 3.6 million tonnes per annum methanol production and export facility at the Port of Kalama in Southwest Washington, USA. The plant will convert regionally-sourced natural gas to methanol, which will then be transported via ship – the equivalent of an MR cargo every four days – for use in dedicated production in Asia.
- We will also provide and operate purpose-built next-generation methanol dual-fueled ships to transport one-third of the methanol volume produced by the plant. These vessels will be tied to 19 year charters with a satisfactory guaranteed return during the period.
- Our order of two LR2 newbuilds equipped with Liquified Natural Gas (LNG) propulsion from Guangzhou Shipyard International (GSI). The vessels will be immediately chartered by a French energy company on long-term time charters with fixed earnings upon delivery in 2023. These dual-fuel vessels were meticulously designed to encapsulate the traits we believe are necessary for ships of the future.
- Additional fuel optimisation efforts for the current fleet. This includes intermediate dry dockings, installation of Mewis ducts, propeller boss cap fins, waste heat recovery unit for generators, among other initiatives.
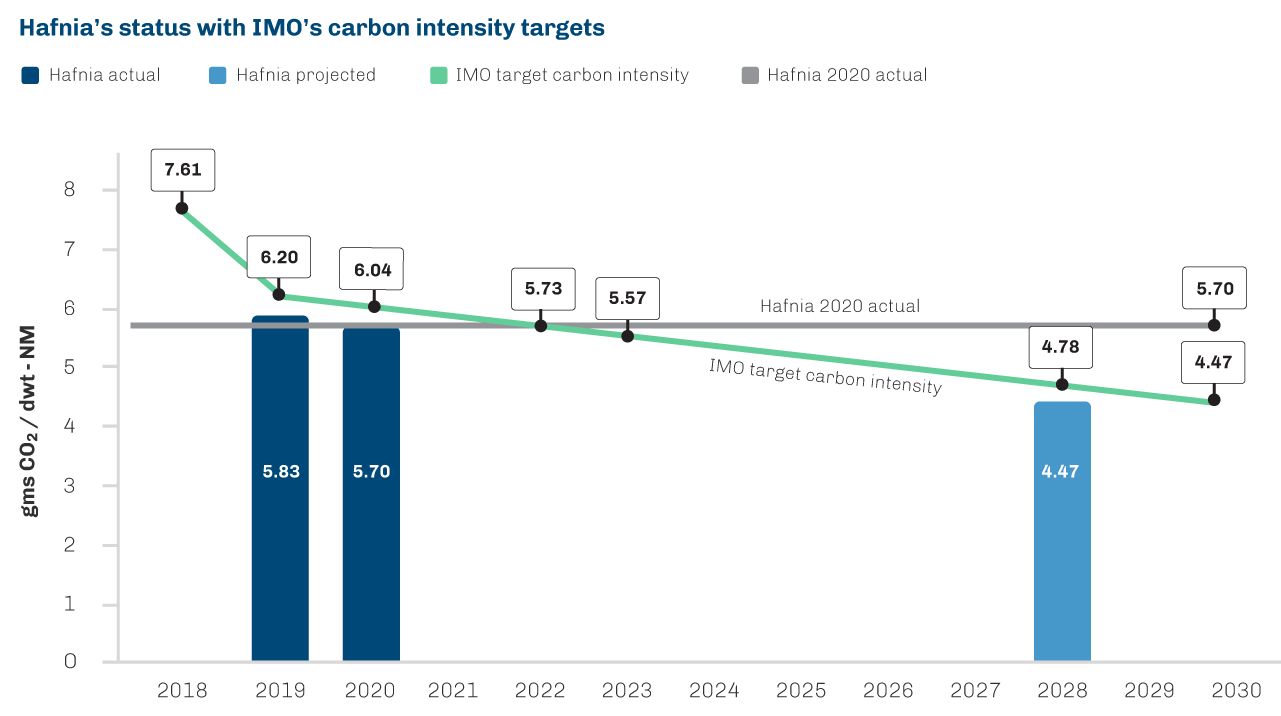
Through years of investments in emissions reduction measures and the continuous optimisation of our vessel operations, Hafnia has achieved significant milestones in reducing overall emissions and improving vessel efficiency. We are in full compliance with the IMO 2020 regulations on sulphur emissions, and we fully support and are on track to meet the IMO’s greenhouse gas (GHG) reduction goals of reducing carbon intensity by 40% and total annual GHG emissions by 50% by 2030, with 2008 levels as the baseline.
In 2020, across Hafnia’s owned fleet, our carbon intensity was 5.70 grams/ton nautical mile (T NM), 5.6% below the present IMO baseline. This progress is in line with our goal of reaching IMO 2030’s target of 4.47 grams/T NM by 2028. Standard vessel optimisation efforts will be supplemented with additional initiatives such as intermittent dry dockings and opportunistic fleet renewals to reach our goal.
Financial highlights and return of capital
Hafnia achieved a net profit of USD 148.8 million and earnings per share of USD 0.41. The commercially managed pool business generated an income of USD 23.0 million.
Hafnia paid a dividend of USD 0.21 per share following the first and second quarter of 2020 equivalent to 51.8% of the annual net profit and 11.2% of our market cap as per 31 December 2020.
Looking ahead
I am pleased to share that our performance in 2020 has been strong, considering the severe impact of Covid-19. Looking ahead, I still believe that further consolidation is needed within the product tanker sector to fully unleash value and synergies from additional operational scale. We will continue to search for such opportunities.
Lastly and most importantly, I extend my deep gratitude to all of our employees, customers, partners and suppliers for their extraordinary efforts during these challenging times. In the face of Covid-19, international shipping has proven to be as essential as ever. At Hafnia, we will continue to prioritise our employees’ health and well-being so we can continue to serve the world and live up to our mission to be Best on Water.
Mikael Skov, CEO
| For the 3 months ended 31 December 2020 | LR2 | LR1 | Panamax | MR | Handy | Total |
| Vessels on water at the end of the period3 | 6 | 25 | 4 | 47 | 13 | 95 |
| Number of operating days4 | 552 | 2,297 | 355 | 4,051 | 1,167 | 8,422 |
| Total calendar days (excluding TC-in) | 552 | 2,072 | 368 | 3,772 | 1,196 | 7.960 |
| TCE (USD per operating day) | 27,108 | 13,649 | 8,640 | 10,836 | 9,476 | 12,389 |
| OPEX (USD per calendar day)5 | 7,606 | 7,830 | 4,669 | 7,803 | 6,522 | 7,459 |
| G&A (USD per operating day)6 | 853 | |||||
| Average broker value for owned fleet (USD milllion) | 282.0 | 374.0 | 15.07 | 1,009.9 | 212.0 | 1,892.9 |
1 Annualised.
2 LTV ratio is calculated as borrowings on thevessels (net of cash) divided by vessel values.
3 Excluding five LR1s and one LR1 newbuild owned through 50% ownership in Vista Shipping Pte Ltd; and including Compass and Compassion (classified as assets held for sale).
4 Total operating days include operating days for vessels that are time chartered-in.
5 OPEX includes vessel running costs and technical management fees.
6 G&A adjusted for cost incurred in managing external vessels in the pools.
7 Excluding Compass and Compassion (classified as assets held for sale)
Key figures
| Q1 2020 USD million |
Q2 2020 USD million |
Q3 2020 USD million |
Q4 2020 USD million |
YTD 202 USD million |
|
| Income statement | |||||
|---|---|---|---|---|---|
| Operating revenue | 268.4 | 268.9 | 165.5 | 171.3 | 874.1 |
| TCE income | 193.5 | 206.9 | 118.5 | 104.3 | 623.2 |
| EBITDA | 129.6 | 145.9 | 51.7 | 35.6 | 362.8 |
| Operating profit (EBIT) | 91.0 | 107.0 | 10.4 | (14.8) | 193.6 |
| Financial items | (14.7) | (12.1) | (10.7) | (9.7) | (47.2) |
| Share of profit from associates and joint venture | 1.2 | 3.4 | 1.2 | (0.8) | 5.0 |
| Profit before tax | 77.5 | 98.4 | 0.8 | (25.3) | 151.4 |
| Net profit for the period/year | 77.1 | 97.7 | 0.4 | (26.4) | 148.8 |
| Balance sheet | |||||
| Total assets | 2,721.6 | 2,692.3 | 2,609.5 | 2,543.9 | 2,543.9 |
| Total liabilities | 1,581.5 | 1,477.8 | 1,436.1 | 1,395.9 | 1,395.9 |
| Total equity | 1.140.1 | 1,214.5 | 1,173.3 | 1,148.0 | 1,148.0 |
| Cash and cash equivalents | 128.5 | 148.0 | 122.6 | 100.7 | 100.7 |
| Key financial figures | |||||
| Return on Equity (RoE) (p.a.)1 | 27.3% | 33.5% | 0.1% | (9.3%) | 13.1% |
| Return on Invested Capital (p.a.)1 | 15.6% | 18.3% | 2.6% | (1.6%) | 8.9% |
| Equity ratio1 | 41.9% | 45.1% | 45.0% | 45.1% | 45.1% |
| Net loan-to-value (LTV) ratio2 | 56.0% | 53.7% | 56.0% | 57.9% | 57.9% |
| Earnings per share (EPS”) | 0.21 | 0.27 | – | (0.07) | 0.41 |
| Dividend per share (DPS”) | 0.1062 | 0.1062 | – | – | 0.21 |